Python使用add_subplot与subplot画子图操作示例
615人浏览 / 0人评论
本文实例讲述了Python使用add_subplot与subplot画子图操作。分享给大家供大家参考,具体如下:
子图:就是在一张figure里面生成多张子图。
Matplotlib对象简介
FigureCanvas 画布
Figure 图
Axes 坐标轴(实际画图的地方)
注意,pyplot的方式中plt.subplot()参数和面向对象中的add_subplot()参数和含义都相同。
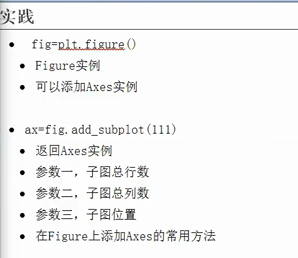
使用面向对象的方式
#!/usr/bin/python
#coding: utf-8
import numpy as np
import matplotlib.pyplot as plt
x = np.arange(0, 100)
fig = plt.figure()
ax1 = fig.add_subplot(221)
ax1.plot(x, x)
ax2 = fig.add_subplot(222)
ax2.plot(x, -x)
ax3 = fig.add_subplot(223)
ax3.plot(x, x ** 2)
ax4 = fig.add_subplot(224)
ax4.plot(x, np.log(x))
plt.show()
pyplot的方式
#!/usr/bin/python
#coding: utf-8
import numpy as np
import matplotlib.pyplot as plt
x = np.arange(0, 100)
plt.subplot(221)
plt.plot(x, x)
plt.subplot(222)
plt.plot(x, -x)
plt.subplot(223)
plt.plot(x, x ** 2)
plt.subplot(224)
plt.plot(x, np.log(x))
plt.show()
运行结果:

更多关于Python相关内容感兴趣的读者可查看本站专题:《Python数学运算技巧总结》、《Python字符串操作技巧汇总》、《Python编码操作技巧总结》、《Python数据结构与算法教程》、《Python函数使用技巧总结》、《Python入门与进阶经典教程》及《Python文件与目录操作技巧汇总》
希望本文所述对大家Python程序设计有所帮助。
您可能感兴趣的文章:
- python Matplotlib画图之调整字体大小的示例
- 解决Linux系统中python matplotlib画图的中文显示问题
- Python学习之用pygal画世界地图实例
- 使用Python的turtle模块画图的方法
- Python通过matplotlib画双层饼图及环形图简单示例
- Python实现读取txt文件并画三维图简单代码示例
- 基于Linux系统中python matplotlib画图的中文显示问题的解决方法
- Python使用Matplotlib实现雨点图动画效果的方法
- Python tkinter实现的图片移动碰撞动画效果【附源码下载】
- Python实战小程序利用matplotlib模块画图代码分享
- Python matplotlib画图实例之绘制拥有彩条的图表
- Python matplotlib 画图窗口显示到gui或者控制台的实例


微信公众号

关注微信公众号获取更多VSCode编程信息,定时发布干货文章

全部评论